
Infographic outreach is the process of promoting a published infographic to bloggers, journalists, and publishers who might embed it or link to it. You create the visual asset, then systematically contact relevant sites to get it placed, embedded, or cited – earning backlinks and referral traffic in the process. When done correctly, a single infographic can generate 20-50 editorial placements from one distribution push.
This guide covers what infographic outreach is, how to build an infographic worth promoting, how to find the right publishers to pitch, what to say in your outreach, and how to handle the embed code and directory strategy that turns one graphic into a sustained link-building asset.
What Is Infographic Outreach?
Infographic outreach is a link building tactic that uses a visual content asset – an infographic – as the hook for editorial placement requests. The core idea: publishers are more likely to share and embed a well-designed visual than to link to a text article covering the same information. An infographic gives them a piece of content their audience wants to see, making the ask mutual rather than one-sided.
The tactic works because it flips the outreach dynamic. Instead of asking a site to link to your article, you are offering to share a content asset they can use. The link back to your domain comes built into the embed code. Publishers who embed get ready-made content; you get an editorial backlink from their domain.
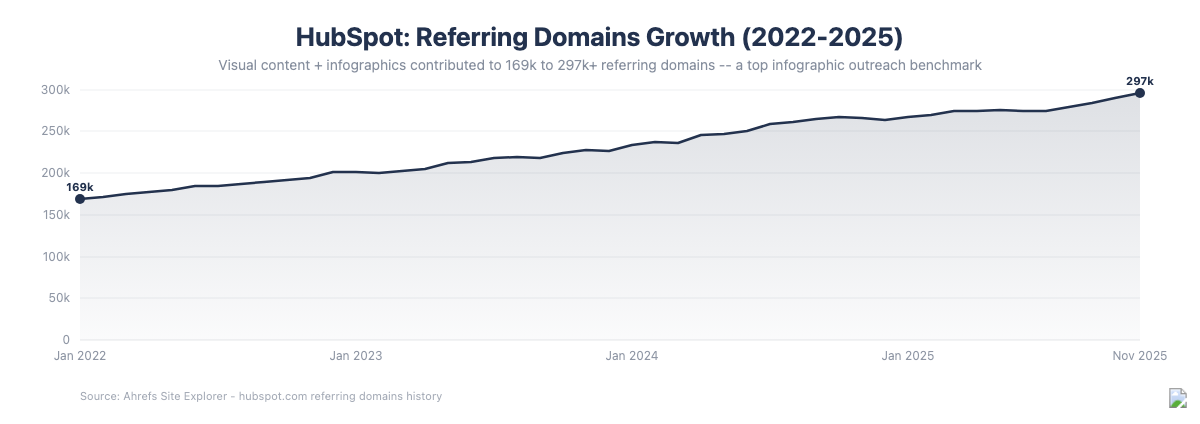
HubSpot is one of the clearest benchmarks for what consistent infographic and visual content strategy produces at scale. Their referring domains grew from 169k to 297k+ in three years – with infographics contributing to both organic embeds and editorial links across marketing publications.
Why Infographic Outreach Still Works for Link Building
Infographics fell out of fashion with some link builders after Google’s 2013 crackdowns on low-quality guest posts and embeds. The tactics that stopped working were the ones that relied on low-editorial sites accepting any infographic submission in exchange for a link. Quality infographic outreach to genuine editorial publishers never stopped working.
The reasons infographics earn links that text content does not:
- Embeddability. Publishers can include your infographic in their article with a single block of HTML. They get free visual content; you get a link. Text articles cannot be embedded this way.
- Shareability. Infographics are shared on social platforms at rates far exceeding equivalent text content. More social shares means more organic discovery by potential linkers.
- Visual learning preference. Visual content is processed faster and retained longer than text. Publishers targeting general audiences know their readers respond better to visuals.
- Reverse image search discovery. Publishers looking for visuals on a topic will find your infographic through Google Image Search and may embed it organically without any direct outreach.
How to Create an Infographic Worth Outreaching
The most common reason infographic outreach fails is that the infographic itself is not worth sharing. Before investing in outreach, the asset needs to pass three tests:
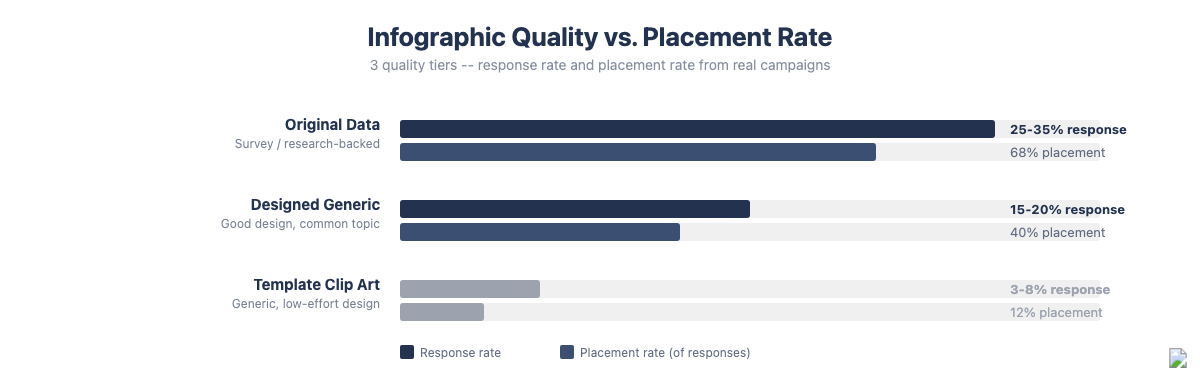
The chart below shows how dramatically infographic quality affects campaign outcomes. Original data-backed infographics achieve response rates 3-5x higher than template-based clip-art visuals.
The Data Test
Strong infographics visualize data or a complex process that is genuinely difficult to communicate in text. The best infographics answer one of these: What do the numbers show? How does this process work step by step? What is the relationship between these variables? If your infographic is just illustrating facts that are easy to communicate in text, it is not adding enough value to earn an embed.
Data sources matter. Use primary research (your own surveys or analysis), official statistics (government databases, industry associations), or well-known third-party data sets. Avoid scraping competitor content or using data from unverifiable sources – publishers check, and editorial sites will decline embeds based on weak sourcing.
The Design Test
The infographic must be visually clean, clearly structured, and professionally executed. It does not need to be award-winning design, but it cannot look amateur. Use a consistent color palette, readable typography (minimum 10pt at full size), clear hierarchy between title, body, and labels, and a logical visual flow from top to bottom. Include your domain name and source attribution at the bottom.
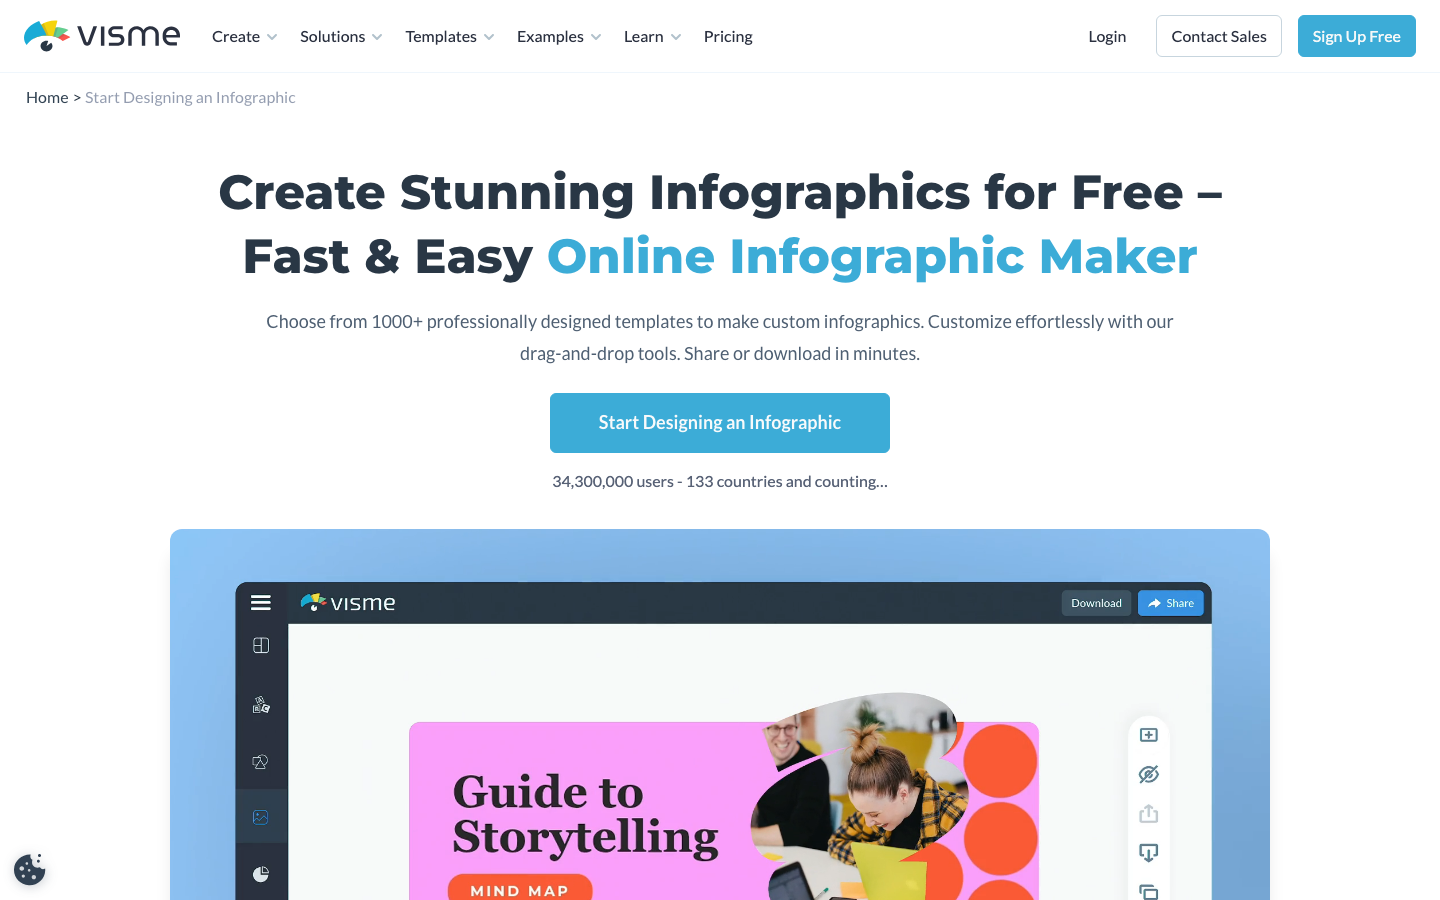
Optimal dimensions for infographic outreach: 800px wide, 2000-4000px tall. This fits comfortably in most CMS column widths without requiring resizing, and the vertical format renders well on both desktop and mobile. Tools like Visme make it straightforward to produce this format without a design background.
The Topic Fit Test
The infographic should cover a topic with a wide enough publisher base to make outreach viable. A highly niche topic may produce a great infographic but only 10-20 relevant publishers. A topic with broad industry coverage and hundreds of relevant blogs and trade publications creates a larger target pool. Before commissioning the infographic, validate that enough publishers exist to make the outreach effort worthwhile.
Building Your Outreach Target List
The quality of your target list determines outreach results more than the quality of your email template. A strong infographic pitched to the wrong sites produces nothing. Here is how to build a list of publishers likely to embed.
Find Sites That Have Embedded Similar Infographics
Use Google reverse image search to find other infographics on your topic. Upload the image to images.google.com or paste its URL. Google returns all pages that have embedded or linked to that image. Each page in the results is a publisher who has already demonstrated willingness to embed infographics on this topic. They are your highest-probability targets.
Use Ahrefs Content Explorer
Search Ahrefs Content Explorer for your topic keyword and filter by pages that have received significant organic traffic and backlinks. Publishers producing well-read content on your topic are the most likely to embed a relevant infographic. Export this list and filter by domain rating (aim for DR 30+) and organic traffic (aim for 1,000+ monthly visits per domain).
Google Search Operators
Use search operators to find blogs and publications in your niche:
"[your topic]" + "infographic" site:wordpress.com OR site:[niche publication]intitle:"infographic" "[your keyword]""[your topic]" "submit an infographic" OR "share your infographic"
Build the prospect list in a spreadsheet. For each prospect, note the domain, DR, the specific page or section where the embed would fit, and the editor or contributor contact email. Keep the list manageable – 50-100 highly qualified prospects outperforms 500 weakly qualified ones.
The Infographic Outreach Email
The outreach email for infographic placement is different from standard link building outreach. You are offering something, not just asking. The email should be short, specific, and lead with the value you are delivering.
What Works in the Subject Line
Subject lines that reference the recipient’s content, their topic area, or a specific angle outperform generic „I have an infographic for you“ lines. Examples that convert:
- „Infographic for your [topic] readers – free to use“
- „Visual resource on [topic] – fits your [specific article title]“
- „[First name] – infographic that goes with your [topic] content“
Email Body Structure
A successful infographic outreach email has four parts:
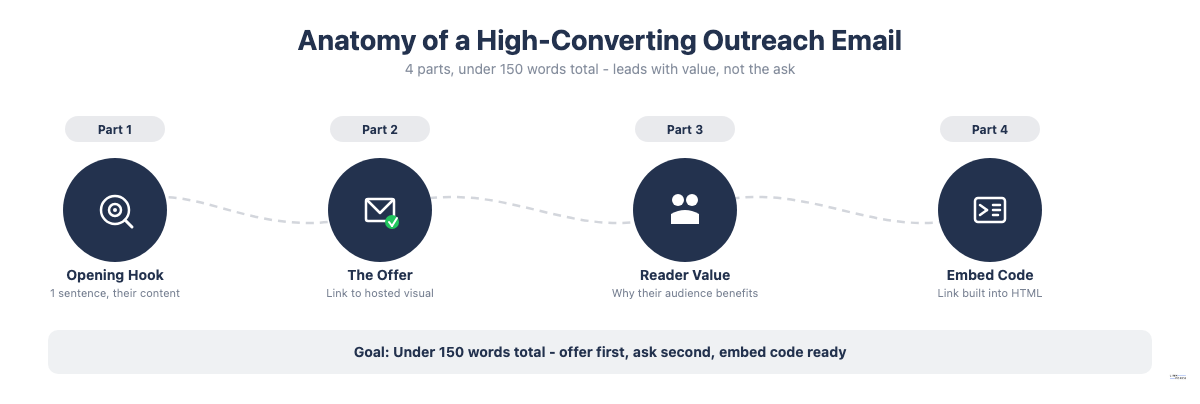
- Opening hook. Reference their site or a specific article they published. One sentence. Show you actually looked at their content.
- The offer. „I have an infographic on [topic] that fits well with your [specific article or section]. Here is the image: [direct link]. Free to embed.“
- The value for them. One sentence on why their readers would find it useful.
- The ask and embed code. „If you’d like to include it, here is the embed code: [code]. I will add a link back to your site from our infographic landing page.“
Total length: under 150 words. Do not attach the infographic – link to a hosted version. Attachments get caught by spam filters and make the email feel less editorial.
Sample Infographic Outreach Email
Subject: Infographic for your [topic] readers
Hi [Name],
I read your post on [specific topic] – useful breakdown of [specific point].
I recently produced an infographic visualizing [data/process] that might go well with your content. Here it is: [URL]. Free to embed.
If it fits, here is the embed code: [code]
Happy to adjust the design or add your logo to the footer if helpful.
[Your name]
Creating and Using the Embed Code
The embed code is what makes infographic outreach a link building tactic rather than just content distribution. Every publisher who embeds your infographic using the code gets a backlink to your domain built into the HTML.
Standard embed code format:
<p><a href="https://yourdomain.com/infographic-page/"><img src="https://yourdomain.com/wp-content/uploads/infographic.png" alt="[Infographic Title] - [Your Brand]" width="800" /></a></p>
<p>Source: <a href="https://yourdomain.com/infographic-page/">[Your Brand]</a></p>
Two important rules for the embed code:
- Use brand name or URL as anchor text, not keyword-rich anchor text. Over-optimized anchor text in embed codes is a known penalty risk. „YourBrand.com“ or „Source: YourBrand“ is safer than „best link building guide.“
- Link to the infographic landing page, not directly to the image file. The landing page is where you can add context, a full-size version, and additional links to related content.
Infographic Directory Submissions
Infographic directories are platforms that aggregate and publish infographics from multiple sources. Submitting to them earns additional links and increases the chance that other publishers discover your infographic organically.
Active directories worth submitting to:
- Visual.ly
- Daily Infographic (dailyinfographic.com)
- Infographic Journal
- Reddit (r/Infographics, niche subreddits)
- Pinterest (treated as a directory by many SEOs due to follow links)
Critical rule for directory submissions: write a unique description for each submission. Directory moderators check for duplicate content, and unique descriptions significantly increase acceptance rates. One SEO reported a 250%+ increase in directory submission success after switching from copy-paste descriptions to unique writeups per directory.
Follow-Up Strategy
Most placements come from follow-up, not first contact. Send one follow-up email 5-7 days after the initial outreach if you receive no response. Keep it short: „Just checking in on the infographic I sent last week – let me know if you’d like to use it or if you have any questions.“
Do not send more than two emails per prospect (initial + one follow-up). Aggressive sequences damage your domain’s sender reputation and burn relationship potential with sites you may want to work with again.
Tracking and Measuring Infographic Outreach Results
Track three metrics for each campaign:
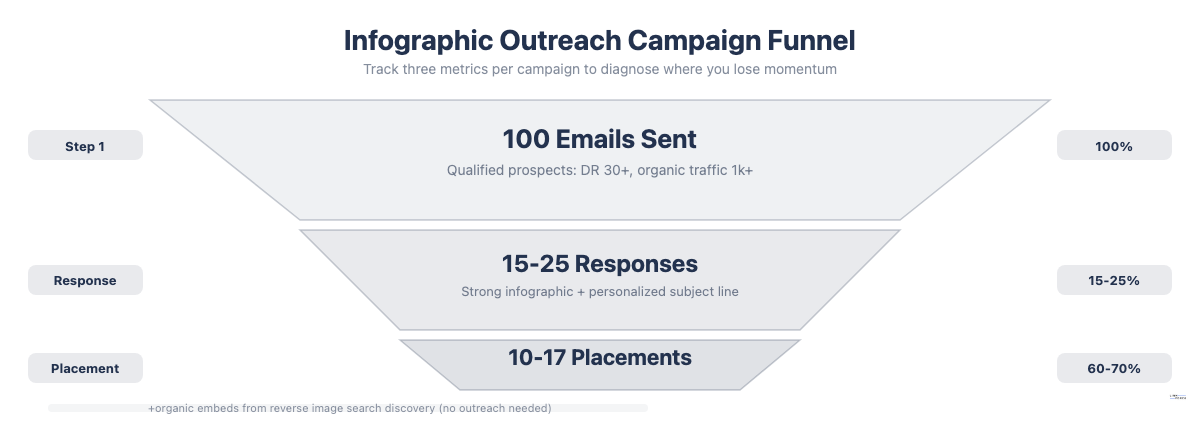
- Response rate. Total responses divided by emails sent. A strong infographic on a relevant topic with a personalized email should get 15-25% response rates.
- Placement rate. Total placements divided by responses. Of the people who respond positively, how many actually embed the infographic? Aim for 60-70%.
- Links earned. The total number of new backlinks attributed to the campaign. Track this in Ahrefs by monitoring new referring domains after the campaign launches.
Set up a Google Alert for the infographic title and your brand name during and after the campaign to catch organic embeds you did not directly solicit. Reverse image search on the infographic URL monthly to find new placements.
Common Infographic Outreach Mistakes
- Pitching the infographic before it is live. Publishers want to preview the asset before committing. Always have a hosted version ready with a direct link before sending outreach.
- Sending attachments instead of a link. Attachments trigger spam filters and make the email feel less credible. Host the image and link to it.
- Using keyword-stuffed anchor text in the embed code. This creates an unnatural link pattern. Use brand name or URL anchors.
- Targeting sites with no history of embedding visual content. Check whether a site has previously used infographics before investing outreach effort in it.
- Submitting identical descriptions to infographic directories. Write unique descriptions for each directory to improve acceptance rates.
- Stopping after the first outreach wave. New relevant articles are published daily. Set a calendar reminder to do follow-up rounds of outreach 1-2 months after the initial campaign for high-performing infographics.
Frequently Asked Questions
How many backlinks can an infographic earn?
Results vary widely by topic, design quality, and outreach volume. A well-executed campaign targeting 100 qualified publishers typically earns 15-35 editorial placements from direct outreach, plus additional organic embeds discovered later. Top-performing infographics on widely covered topics have earned hundreds of links over months of organic discovery and continued distribution.
How much does an infographic cost to produce?
Basic infographics from freelance designers run $100-$500. Mid-range agencies producing research-backed, custom-designed infographics charge $1,000-$3,000. High-end data visualization studios for complex datasets can reach $5,000-$15,000. For link building purposes, the $500-$2,000 range typically produces assets with enough quality to earn genuine editorial placements.
Is infographic outreach still effective in 2026?
Yes, when the infographic visualizes original data or explains a genuinely complex process. The tactics that stopped working were template-based infographics recycling common knowledge submitted to low-quality directories en masse. Quality visual content pitched to relevant editorial publishers still earns placements, often at higher response rates than text-only outreach because the publisher receives a usable content asset rather than just a link request.
What is the difference between infographic outreach and infographic marketing?
Infographic marketing is the broader category – all activity around creating and distributing infographics to reach an audience. Infographic outreach is the specific tactic of directly contacting publishers to request embedding or linking to an infographic. Marketing includes paid distribution, social sharing, and organic SEO; outreach focuses specifically on editorial placement through direct contact.